Sample case studies
Results, shown month by month
Six sample clients, six trades. Every case study shows the same three numbers we put on every report: calls, cost per lead and booked jobs.
All clients and figures on this page are fictional sample data.
All case studies

From 38 calls a month to 131 for a Northside plumber
- Calls a month
- +245%
- Cost per lead
- -57%
- Booked jobs
- +276%
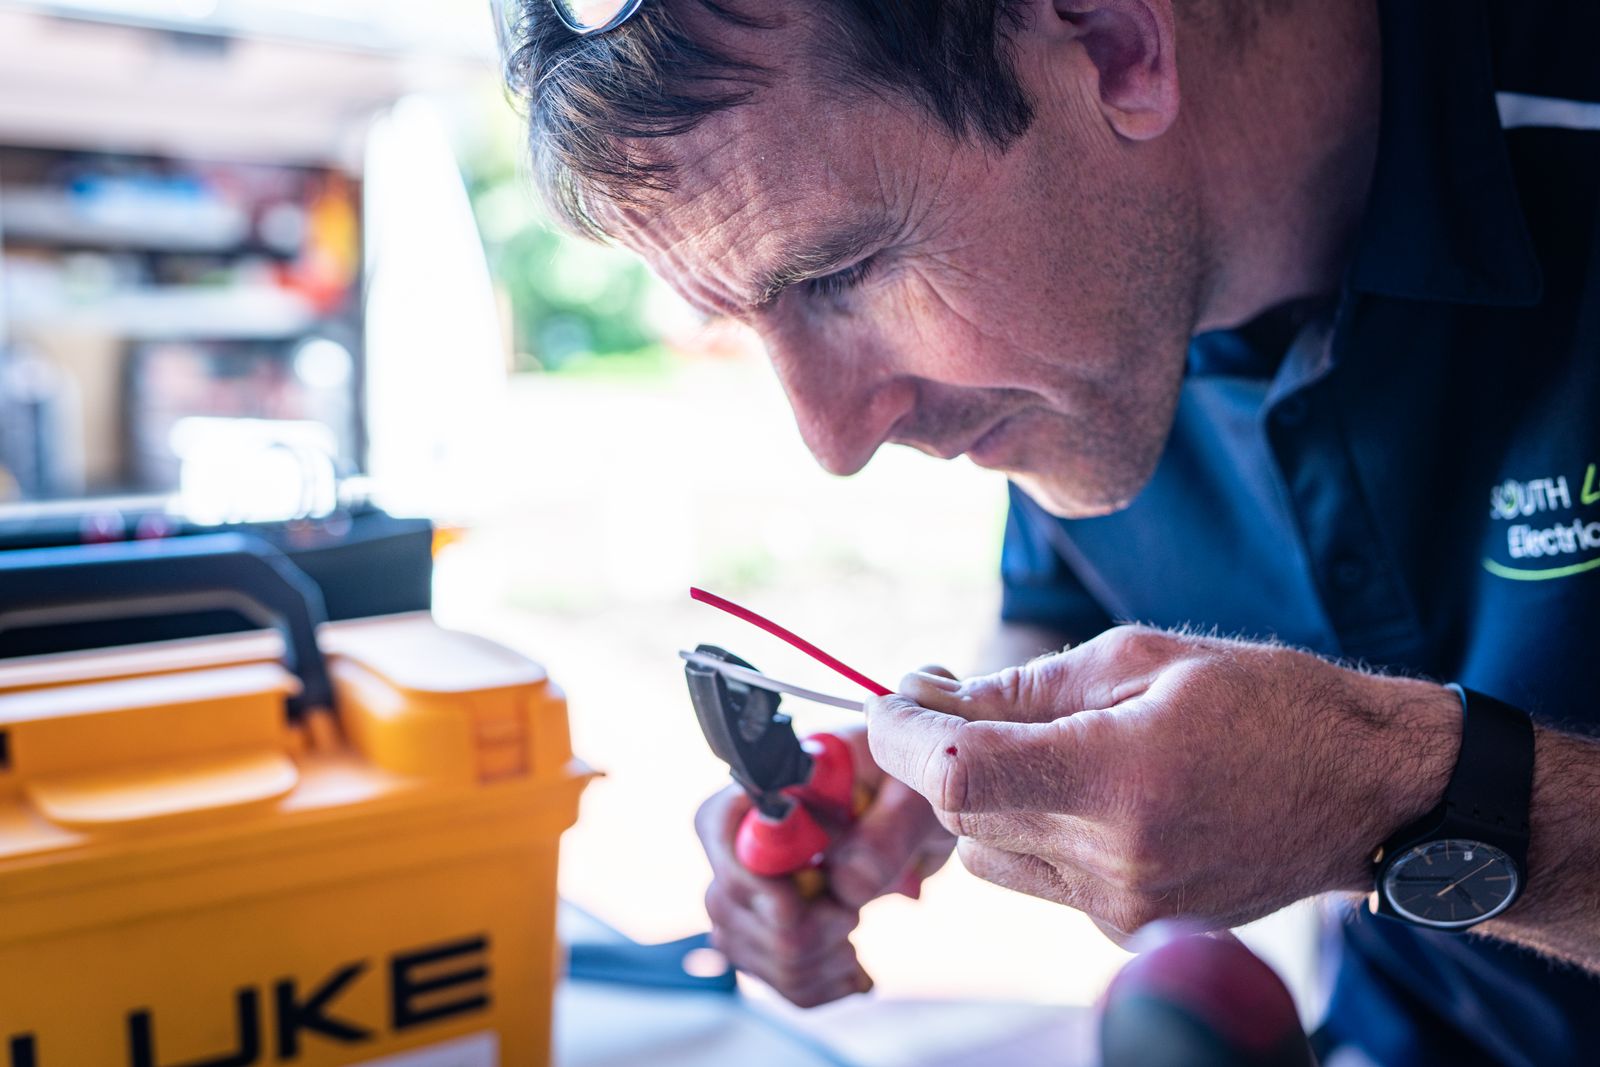
Cost per lead cut from $118 to $52 for a Southside sparky
- Calls a month
- +300%
- Cost per lead
- -56%
- Booked jobs
- +356%

Fewer tyre-kickers and four times the site visits for a renovator
- Calls a month
- +244%
- Cost per lead
- -53%
- Booked jobs
- +325%

14 reviews to 187 and a waitlist for a Springfield cleaner
- Calls a month
- +280%
- Cost per lead
- -53%
- Booked jobs
- +337%

New patient calls tripled for a North Lakes dental practice
- Calls a month
- +209%
- Cost per lead
- -47%
- Booked jobs
- +246%

A full diary across five practitioners at a Logan physio clinic
- Calls a month
- +187%
- Cost per lead
- -46%
- Booked jobs
- +229%
All six, added up
Combined tracked calls and average cost per lead across the six sample clients over their first six months.
Combined tracked calls per month
208 at the start, 697 by month six
View as table
| Period | Calls |
|---|---|
| Start | 208 |
| Month 1 | 293 |
| Month 2 | 385 |
| Month 3 | 468 |
| Month 4 | 556 |
| Month 5 | 634 |
| Month 6 | 697 |
Average cost per lead
Lower is better
View as table
| Period | Cost per lead |
|---|---|
| Start | $116 |
| Month 1 | $98 |
| Month 2 | $84 |
| Month 3 | $73 |
| Month 4 | $64 |
| Month 5 | $58 |
| Month 6 | $54 |
41,200+
tracked calls sent to local businesses (since 2017, sample)
$47
average cost per lead across trade clients (last 12 months, sample)
96%
of clients stay past month six (with no lock-in, sample)
No lock-in contracts
Your trade could be next
Start with a free lead audit. In 20 minutes we will show you where calls are leaking and what to fix first. No lock-in, no hard sell.